
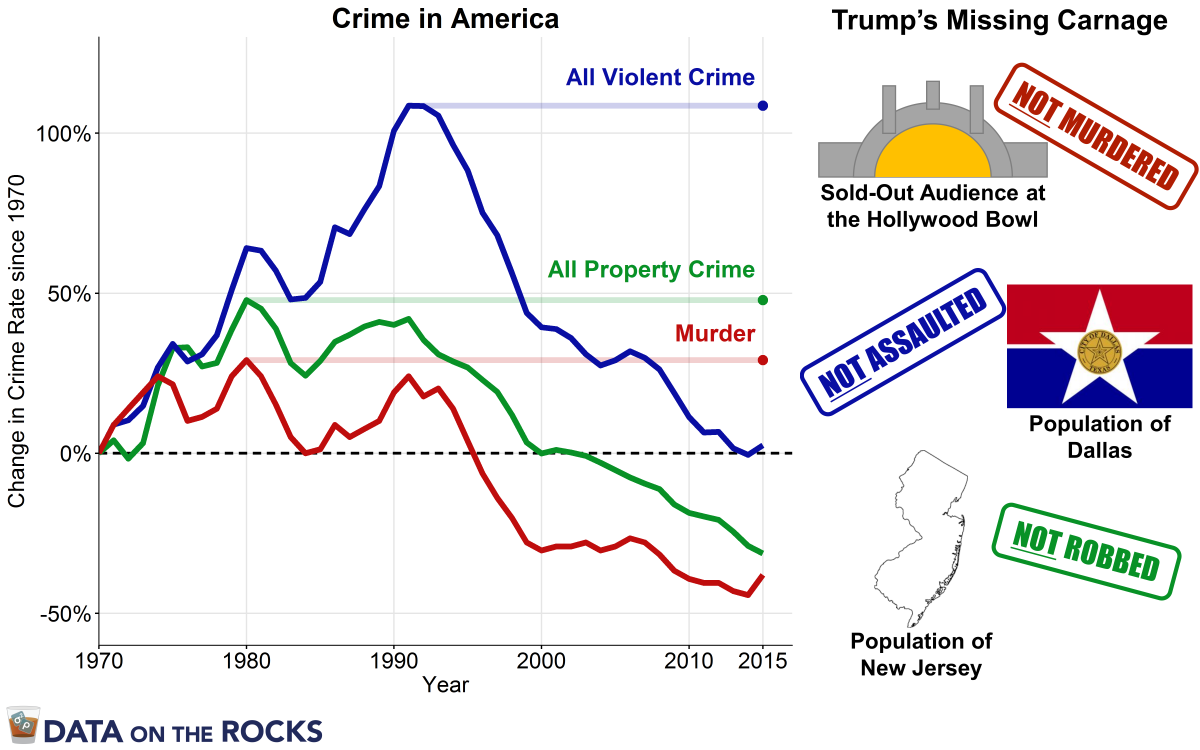
Donald Trump ran for president promising a return to law and order, a pledge which was supported largely by falsehoods. As president, he has repeated these claims, stating that the murder rate in America is the highest it’s been in the past 45-47 years. In fact, the murder rate has been consistently low since the early 2000’s, and crime rates overall have been steadily declining since the early 1990’s. The graph on the left shows the percent change in rates for murder, all violent crime, and all property crime from 1970 to 2015 (the last year complete data is available). To show how much lower the current rates are compared to the highest levels of the past 45 years, the graph also projects these highest levels out to 2015 for easy visual comparison. In order for today’s rates to reach those historic highs, and for Trump’s claim about murder in America to be correct, an entire sold-out audience at the Hollywood Bowl would need to be murdered (over 17,000 people). To match the highest rates of all violent crime, the entire population of Dallas would need to be assaulted (over 1,200,000 people), and to match the highest property crime rate, the entire population of New Jersey would need to be robbed (over 9,000,000 people).
For the Data Wonks
- Donald Trump’s claim about the murder rate can be found at goo.gl/A3TsCL and in video at https://youtu.be/eXYvAWvKqxct.
- Crime rates across the US are collected by the FBI from local police precincts and are compiled into the Uniform Crime Reporting (UCR) databases. These databases can be downloaded at goo.gl/LIgahM and reports can be found at goo.gl/NAfYJy. The data plotted and analyzed for this blog are also available in the Datasets page. The most recent year for which complete data is available is 2015. All rates calculated by the UCR are expressed in terms of the number of crimes per 100,000 people in the population.
- In order to visualize time trends across these three crime rates, percent change values were computed by calculating the difference between the crime rate in a given year minus the crime rate in 1970 and then dividing the rate difference by the 1970 rate.
- In 2015, the nationwide murder rate was 4.9 murders per 100,000. The highest rate since 1970 was 10.2 in 1980. The difference between these two rates is 5.3 per 100,000 people. When multiplied by the population of the country in 2015 (321,418,820), this difference in rates means that to have a murder rate of 10.2 in 2015 an additional 17,035 people would need to have been murdered. For comparison, the maximum capacity of the Hollywood Bowl is 17,500 people.
- In terms of all violent crime, the maximum rate was 758.2 per 100,000 people which occurred in 1991. In 2015, the violent crime rate was 372.6. By multiplying the difference in rates by the US population in 2015, it was calculated that in order to have a violent crime rate of 758.2 in 2015, an additional 1,239,391 people would need to be victims of a violent crime. The population of Dallas Texas is 1,300,092.
- The highest property crime rate since 1970 was 5353.3 per 100,000 in 1980. In 2015 the property crime rate was 2487 per 100,000. By the same math 9,212,828 additional people would need to be victims of a property crime in 2015 in order to match the highest rate in 45 years. The population of New Jersey is 8,944,469.
