
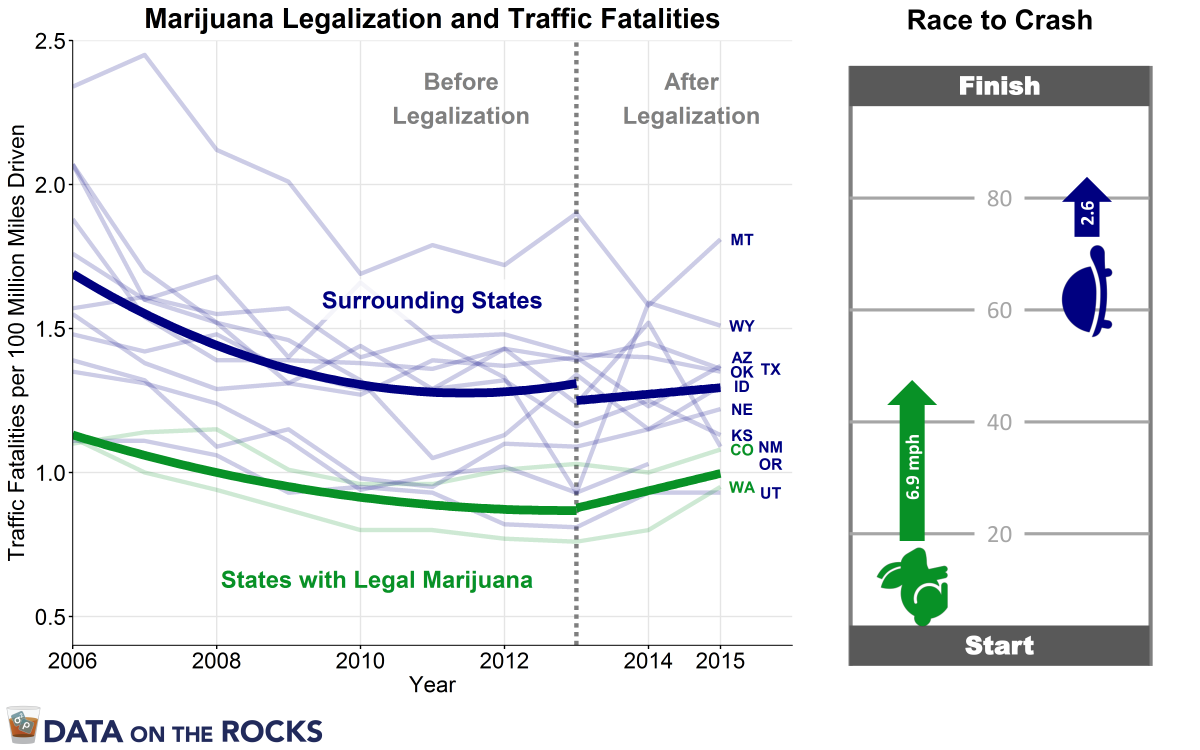
Support for legalizing recreational marijuana has been steadily growing for decades. Last November, California, Nevada, Massachusetts and Maine voted to legalize recreational marijuana for people age 21 or older. Leading up to the election, voters were inundated with arguments from both sides of the debate. One of the most convincing argument against legalization was the risk for increased traffic accidents and fatalities. The graph on the left shows traffic fatality rates in the only two states with multiple years of legal recreational marijuana, Colorado and Washington, versus surrounding states. Although Colorado and Washington had about 30% lower rates of traffic fatalities in general, since legalization their fatality rates have increased 2.7x more quickly than surrounding states. This means that if these trends hold, by 2023 the rates will converge. In terms of an apocryphal tortoise and hare race across a football field, this would be like starting the tortoise at the 63-yard line, but the hare is going 6.9 miles per hour to the tortoise’s 2.6. So please remember not to drive under the influence of any drug including marijuana (and especially alcohol).
For the Data Wonks
- Gallop has been tracking public support for legalizing marijuana since 1969. https://goo.gl/7mF6Ia
- Details on the state of marijuana legalization can be found at: https://goo.gl/ZJtnPa.
- Only Colorado and Washington have legalized recreational marijuana use with at least 2+ years of traffic data with legal marijuana.
- Surrounding states included: Utah, Wyoming, Arizona, New Mexico, Oklahoma, Kansas, Nebraska, Texas, Oregon, Idaho, Montana. Oregon legalized marijuana at the end of 2014, therefore Oregon’s 2015 data was removed from the analyses.
- Traffic fatality rates were collected from the National Highway Traffic Safety Administration (NHTSA) at: https://cdan.nhtsa.gov/. Data was culled for the years 2006 through 2015 since data was not available for 2016. In order to compare across states with variable population sizes and driving patterns, rates of traffic fatalities per 100 million miles driven in each state were downloaded and analyzed.
- In order to account for the nested data structure where traffic fatality rates across years are nested within states, a multilevel modeling framework was utilized via the lme (https://goo.gl/FW8gBx) function in R with random intercepts. Fatality rates were modeled using a piecewise regression approach with a break at 2013, the year marijuana was legalized in Colorado and Washington. Time trends from 2006 through 2012 were modeled using a quadratic time trend due to improved overall fit over a simple linear term (p = 0.0009). The quadratic time trend was also found to closely model raw averages across time for both legalizing states and surrounding states. The model also estimated whether there was a discontinuity in traffic fatality rates in 2013 (through the inclusion of a pre-post 2013 binary intercept term), and whether linear changes rates of fatalities between 2013 and 2015 differed between states with legal marijuana and those surrounding states. The full model results are:
| Value (SE) | t (df) | p-value | |
| (Intercept) | 1.690 (0.081) | 20.858 (108) | < 0.001 |
| Year1 | -0.152 (0.025) | -6.101 (108) | <0.001 |
| Year12 | 0.014 (0.004) | 3.494 (108) | 0.001 |
| Year2 | 0.022 (0.027) | 0.845 (108) | 0.400 |
| PrePost2013 | -0.060 (0.066) | -0.907 (108) | 0.366 |
| State Legalization | -0.559 (0.207) | -2.708 (11) | 0.020 |
| Year1 × State Legalization | 0.076 (0.063) | 1.191 (108) | 0.236 |
| Year12 × State Legalization | -0.008 (0.010) | -0.825 (108) | 0.411 |
| Year2 × State Legalization | 0.038 (0.066) | 0.569 (108) | 0.571 |
| PrePost2013 × State Legalization | 0.069 (0.168) | 0.408 (108) | 0.684 |
7. To generate the tortoise and hare simile, the linear trends for legal states and surrounding states were linearly transformed so as to be in easily interpretable units while maintaining the relative functions. First from the results above I derived the two post-2013 linear trends for legal states and surrounding states (0.877 + .06 × Year post 2013, and 1.25+ .0224 × Year post 2013 respectively). From these equations, I calculated that the two groups would converge in 9.92 years at a final traffic fatality rate of 1.47. A linear multiplier was computed to convert from traffic fatality rate to distance in yards. This multiplier was computed as 100 / (1.47 – .877), and was 168.6. This multiplier was multiplied by the two trends to produce linear trends in yards by year. In order to produce intuitive speeds, the unit of years was switched to units of 3 seconds. This conversion resulted in trends for the tortoise of 62.66 + 3.76 × (3 seconds), and for the hare: 0 + 10.08 × (3 seconds). Lastly, these speeds of 3.76 and 10.08 yards/3 seconds were converted into miles per hour resulting in speeds of 2.57 mph for the tortoise and 6.87 for the hare.
