
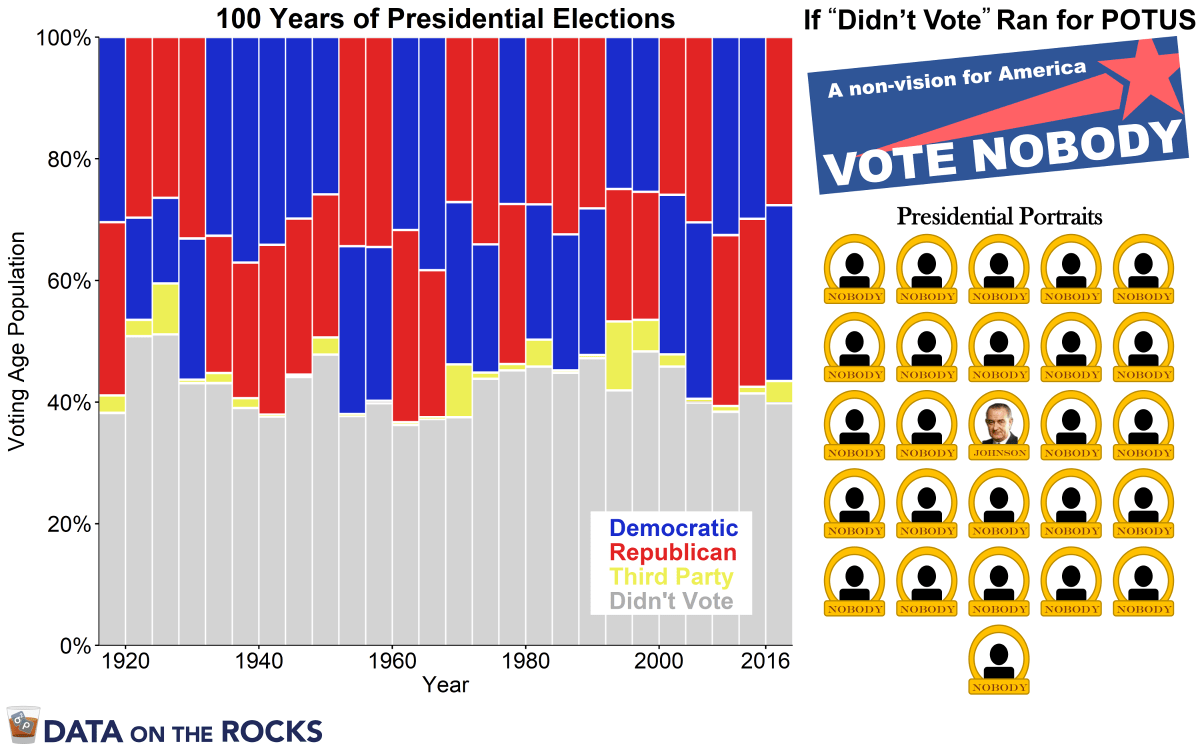
On the one-year anniversary of the 2016 presidential election it is worth looking back at the history of American presidential democracy. One disheartening feature of our democracy is the fact that, compared to many other democratic nations, voter turnout in America is very low. The graph on the left shows the number of votes the Republican, Democratic and combined third party candidates received as a percentage of the total voting age population. Since 1916, only 57% of eligible voters on average cast a ballot for president. As a result, the president is decided by only 30% of eligible voters on average, far less than a majority of the population. If “didn’t vote” was treated as a candidate, Candidate Nobody, she would have won every single election of past 100 years with the sole exception of losing to Lyndon B. Johnson in 1964. American citizens who care about the future of their country need to get informed, motivated and voting. And not just every four years for president. Every election matters.
For the Data Wonks
- The Pew Research Center published an excellent resource about voter turnout in the US and other democracies. Their report can be accessed here: https://goo.gl/SdPsrU
- All election results were accessed from the US Election Atlas maintained by David Liep: https://goo.gl/ZudWGk
- Voter turnout data by year was accessed from the United States Election Project: https://goo.gl/9Ld3PX
- The graph on the left was structured so that the “Didn’t Vote” group was always the bottom segment. Other segments were rank ordered by vote share. The election results for 2000 and 2016 were altered to place the Republican candidate (George W. Bush and Donald Trump respectively) on top since they won the election via the electoral college, but did not carry the popular vote. For visual depiction a gap between party designations was added (0.4%). The effects of this alteration in accuracy was deemed to be trivial and greatly improved the aesthetic of the graph.
- On average, 42.52% of the voting age population didn’t vote (SD = 4.4%). Therefore, the average voter turnout was 100% – 42.52%, or 57.48%.
- The winning candidate (based on the electoral college) received on average 30.46% of the voting age population (SD = 3.7%).
- In 1964, Lyndon B Johnson received 38.3% of the vote, compared to 37.2% of the voting age population that did not vote that year. In every other year the “Didn’t Vote” percentage was greater than the vote share received by either major party candidates. On average the share of the “Didn’t vote” share was 12.6% greater than the winning candidate’s vote share.
