
Today’s post is a bit of a departure for Data on the Rocks. Instead of simply presenting some data with an accompanying analogy, this post is a statistical prediction. The Academy Awards are this Sunday, and the big question as always is which film is going to win Best Picture. The Oscars are notoriously hard to predict, with an eclectic voting body and an atypical voting process. Plus, who can forget the drama last year when La La Land was incorrectly announced as Best Picture instead of the true winner, Moonlight? This animated graphic shows the predicted winner of Best Picture from a statistical model. The model is based on many factors including: the Rotten Tomatoes “All Critics” and “Top Critics” scores, Oscar nominations for other categories, and other major awards nominations/wins. Each point represents the best guess for the probability of a win, and the grey bars represent the uncertainty. After the Golden Globes, Three Billboards Outside Ebbing, Missouri appeared to be the heavy favorite; however, this came with a high degree of uncertainty. The Shape of Water then racked up some wins with the Critics Choice, Producers Guild, and Directors Guild Awards which are historically pretty good predictors of the Oscars top prize. After all the dust settled, The Shape of Water is the modest favorite with around a 50% chance of winning but followed closely by Three Billboards with around a 30% chance.
For the Data Wonks
- Historical data from 1997 through 2017 on all Best Picture and other Oscar nominations were collected from the Awards Database. As always, data is available in Databases.
- Rotten Tomatoes scores were collected for “All Critics” and “Top Critics” to capture general critical reception. Of course, all these movies did quite well critically, but some better than others and that might matter.
- The following other awards show data was also collected for all best picture nominees since 1997: Golden Globes award for Best Drama and Best Musical/Comedy, Critics Choice Awards for Best Picture, Screen Actors Guild award for Outstanding Performance by a Cast in a Motion Picture, British Academy Film Award (BAFTA) for Best Film, Producers Guild of America Award for Best Theatrical Motion Picture, Directors Guild of America Award for Outstanding Directing – Feature Film, and the Writers Guild of America Award for Best Original Screenplay and Best Adapted Screenplay.
- Several models were tested for this prediction including logistic regression modeling, multilevel logistic modeling, and random forest classification. Across all modeling approaches predicted probabilities were computed using the predict() function and all predicted probabilities were re-normalized within each year to ensure that the total probabilities within each year add up to 100%.
- Based on testing with leave-one(year)-out cross-validation, random forest classification slightly outperformed the other modeling approaches in terms of number of correct calls (e.g. how many years did the predicted winner actually win) and more importantly the root-mean square error which was around 27% versus 30% for logistic approaches.
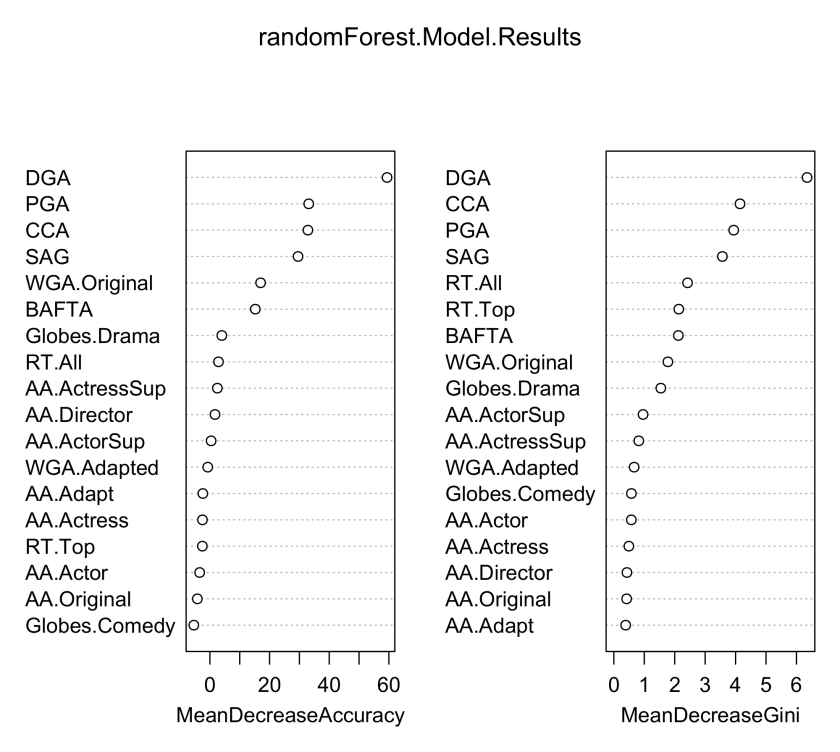
- Variable importance in random forest calculation is based on the mean decrease in classification accuracy, and the Gini index which captures how important a particular variable is in building the classification model. As shown below, the most important variables in predicting best picture are the Directors Guild Award, Critics Choice Award, Producers Guild Award and Screen Actors Guild Award.
- Because the sample size for the model training dataset is relatively small in terms of years (20 years of data with 141 total movies), and to get a non-parametric measure of model uncertainty, a multilevel bootstrapping procedure was used. Specifically, 1000 bootstrapped datasets were generated first by resampling with replacement on the year variable, and then resampling with replacement individual films within each year. This way the overall structure of the data, where films are nested within years, was preserved across all bootstrapped datasets. Identical analyses (specifically random forest classification with 500 trees via the randomForest::randomForest() function) were then performed on all bootstrapped datasets. Predicted values from the 2017 test dataset were then computed, normalized and saved producing 1000 predicted probabilities of winning best picture for each nominated film. Mean probability for each film was computed as the best point prediction (shown with the dots), and an 80% bootstrapped confidence interval of that predicted probability is shown with the bars.
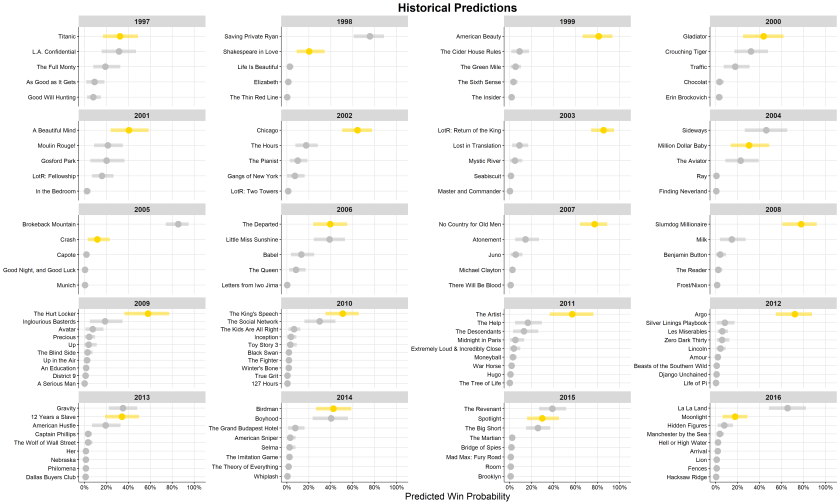
- Historical accuracy of this random forest classification method with bootstrapping is shown below. This approach accurately called 14 of the past 20 Best Picture winners and many miscalls were near second places (e.g. 12 Years a Slave, Spotlight). Moonlight, Crash, and Shakespeare in Love were, according to this model, quite heavy underdogs which fits with the general sentiment from the time.
- The individual plots in the animation were produced by carrying out this bootstrapped random forest method on datasets that were modified to reflect the data available at these different timepoints in the 2017-2018 awards season. I compiled a list of the awards show nomination announcement dates and the awards show dates which allowed me to reconfigure the predictor variables so that they only included those data that was available at the time in question. For example, if nominations had been announced but not awarded, then the test dataset passed to the predict function was modified so wins were recoded as nominations. If nominations weren’t yet out for a particular variable, then that variable was removed from the modeling datasets. A separate plot was produced for each timepoint, and then these plots were combined into an animated gif in GIMP 2.
- The final results of this analysis are below. The Shape of water is the slight favorite to win Best Picture at 95% [80% CI: 31.82%, 68.62%] followed closely by Three Billboards Outside Ebbing, Missouri at 28.66% [80% CI: 15.72%, 42.92%].
Name Mean Pr [80% CI]
The Shape of Water 0.4895 [0.3182, 0.6862]
Three Billboards 0.2866 [0.1572, 0.4292]
Get Out 0.0944 [0.0106, 0.1922]
Lady Bird 0.0919 [0.0212, 0.1684]
Call Me by Your Name 0.0166 [0.0020, 0.0375]
Phantom Thread 0.0125 [0.0018, 0.0278]
The Post 0.0060 [0.0000, 0.0157]
Dunkirk 0.0020 [0.0000, 0.0053]
Darkest Hour 0.0006 [0.0000, 0.0023]
